

5 things we learned from Pleo’s first Quarterly spending report
Everyone loves a good stat.
Data can be catchy and spark discussion but at its core, statistics are important because they help people grasp a better understanding of a situation and make more informed decisions.
Everyone can benefit from insightful data – especially businesses.
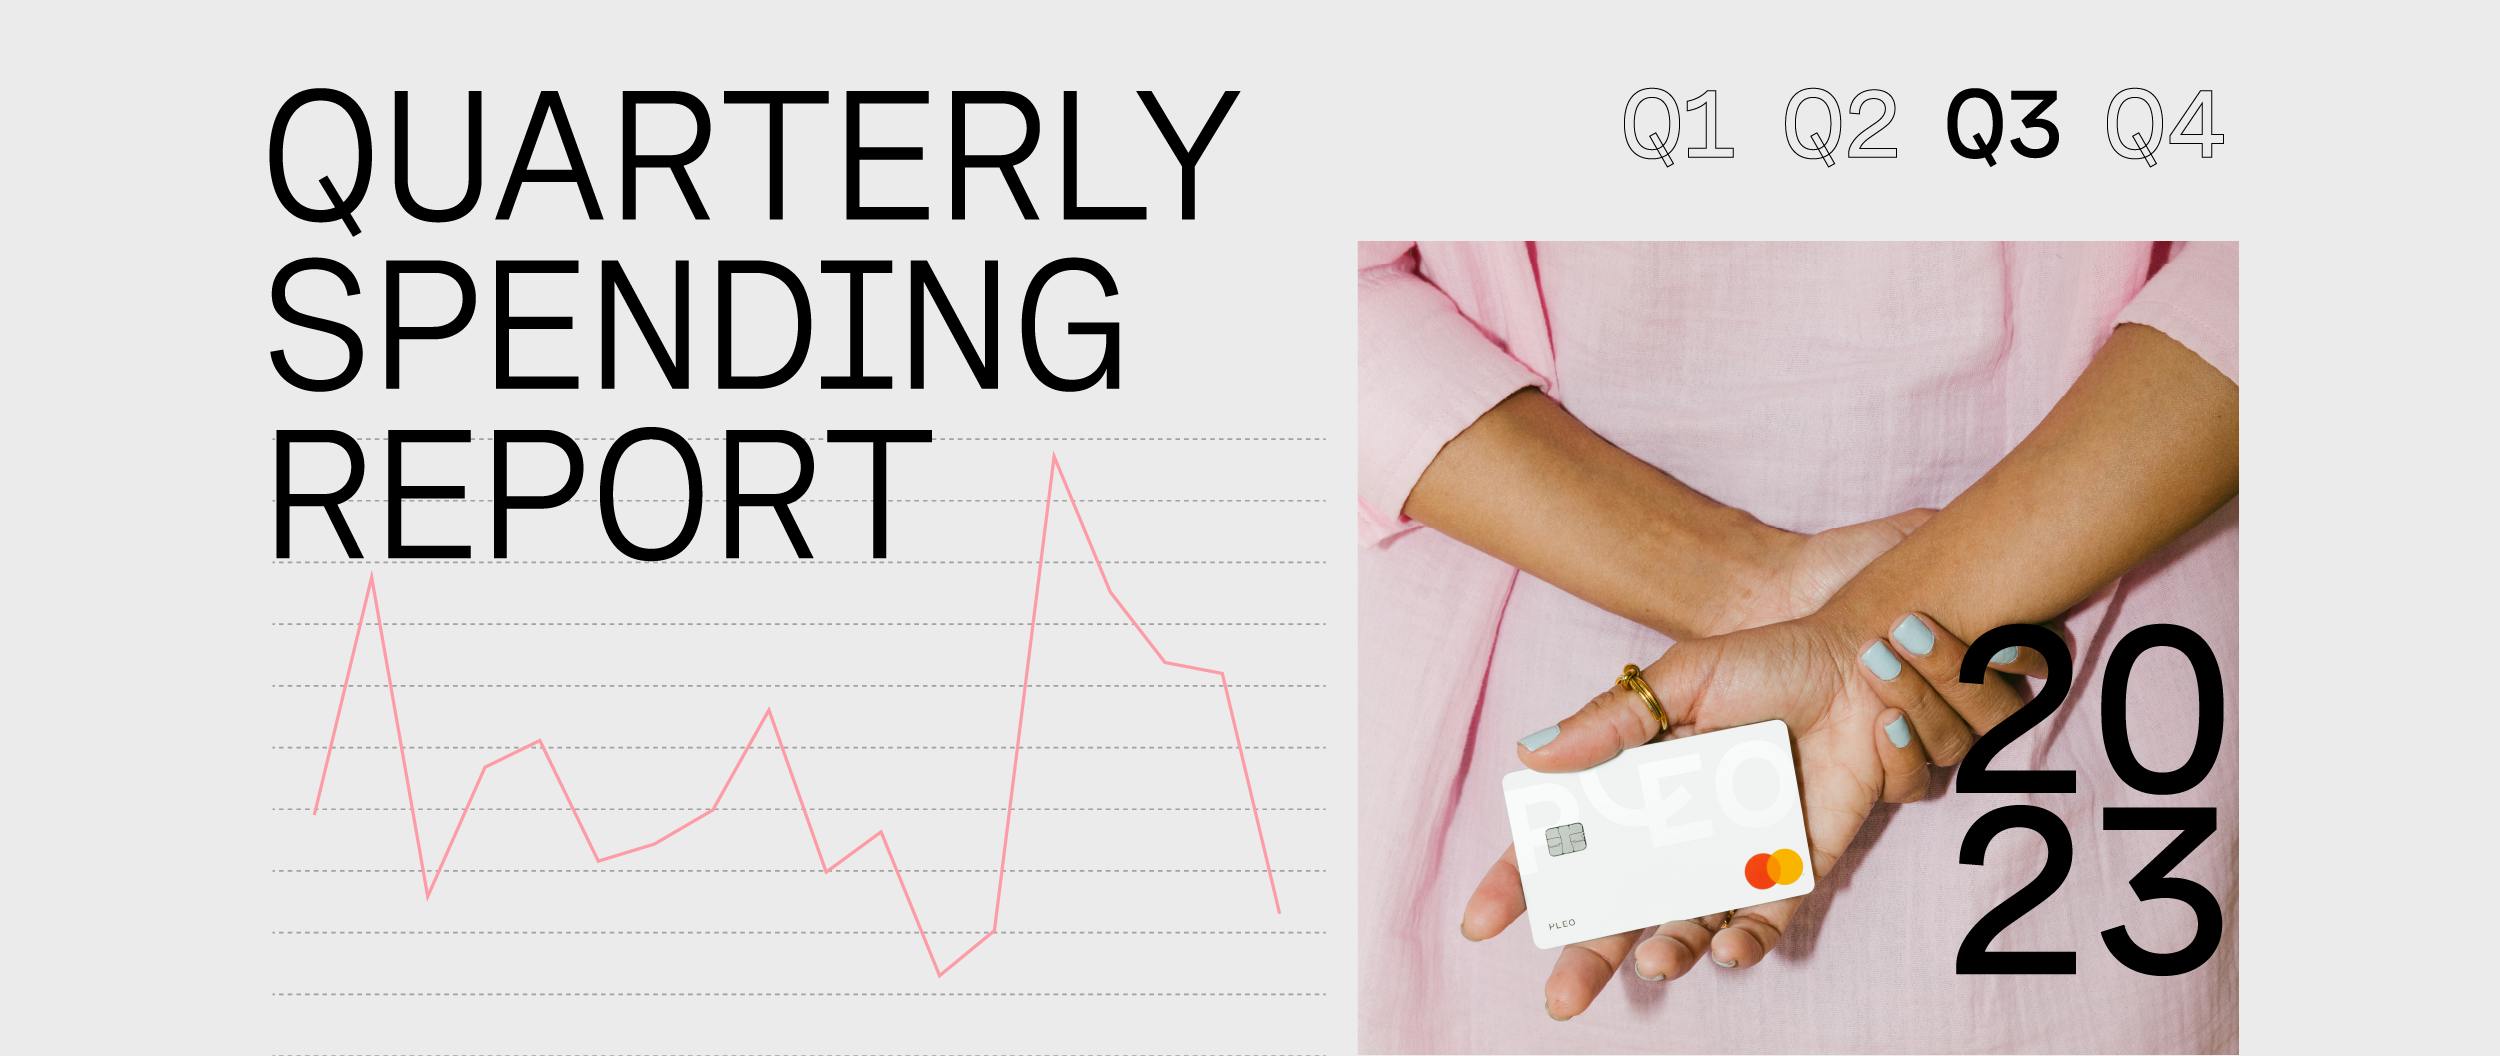
That’s why we’re excited to launch the first edition of Pleo’s Quarterly spending report. This time focusing on how businesses across Europe are prioritising spend based on Q3 data.
Why we launched this report
The past couple of years have been … eventful. Record inflation, rising property costs, political conflicts, disruption of supply chains.
And while Q3 (that’s July, August, September) wasn’t as bleak as anticipated, it doesn’t mean we are out of the woods just yet. In fact, it just solidifies the need for businesses to have a strategic plan that cuts through the noise in this still-challenging and quickly changing market.
To help businesses with this, we’ve created this quarterly report which provides an overview of business spending trends throughout Europe. Based on thousands of aggregated and anonymised Pleo cards, invoices and reimbursement transactions our 30,000+ customers have paid through our spend management platform.
Psst! When presenting market-specific data, our sample comprises of our main European markets: the United Kingdom and Ireland, Germany, the Netherlands, Spain, France, Denmark and Sweden.
What can you expect to find in the report? Well, here are five things we learned from our first edition.
1. Offices are making a comeback
Organisations are looking for ways to drive productivity and build up a workplace culture. Office expenses invoice spend has continued to steadily creep up from Q2, with Equipment & hardware staying steady at around 9% of total spend.
And when it comes to furnishing the office, businesses across markets turn to IKEA (who doesn’t love the Scandi-minimalist look?).
2. It’s time to invest in the tech stack
We also saw that businesses are looking to increase efficiency, which is reflected in an increase in overall spend in the Software category. No surprise to see big players like Amazon Web Services, Atlassian and Hubspot as top merchants in this category across markets.
3. Invoice spending has stayed fairly consistent (except for Marketing & ads)
What was made abundantly clear is that businesses don’t prioritise marketing and advertising spend during the summer. Interestingly, there was a huge jump (nearly doubling!) in marketing and ads invoice spend from May to June, with a sharp decline at the beginning of Q3. It still holds the top spot by transaction volume though.
4. There’s big love for trains
The main method of transportation has shifted from planes to trains, indicating more of a focus on local and more intentional travel. Trainline in the United Kingdom, SJ in Sweden, Deutsche Bahn in Germany and Renfe in Spain make the top ten merchants in their corresponding market for Q3.
5. Businesses are jumping on the TikTok trend
Just as we saw a shift in the method of transportation for business travel, we also observed marketing and advertising strategies shifting as well, with TikTok appearing in the top merchants list for two markets for the first time compared to previous quarters.
To dive deeper into Q3 card and invoice spend, as well as top merchants across seven European markets, don’t miss the full Quarterly spending report!

Benchmark your company’s spend against real-time industry data
Leverage insights from billions of euros of aggregated quarterly spend across 30,000+ Pleo customers
Powered in the UK by B4B partnership


Senior Content Manager
You might enjoy...
.png?ixlib=gatsbyFP&auto=compress%2Cformat&fit=max&dpr=2&w=373)
We’ve secured €40M in debt financing from HSBC Innovation Banking to level up our credit offering
We’re over the moon to share that we’ve secured a €40 million debt financing facility from HSBC Innovation Banking UK, the specialist financ...

Change agents: How finance leaders can help their teams evolve
Since the dawn of time, the traditional finance department has been viewed as a ‘collective of bean counters.’Their days would be filled wit...

Stay on top of all your digital marketing spend with Pleo
From LinkedIn to TikTok to Mailchimp. Let Pleo manage all your digital marketing spend.